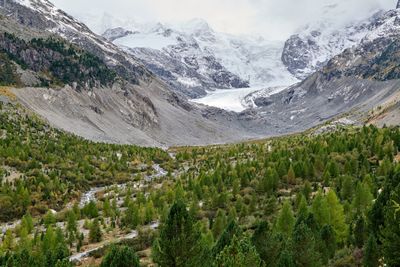
The complexity of this phenomenon often makes it hard to communicate. That is why, in 2022, we founded the non-profit organisation IAMCLIMATE: to share scientifically proven information on the climate crisis in an effective and accessible way, because we believe that everyone has the right and the duty to know what we are facing.
Climate in numbers
Switzerland’s climate stripes, 1864–2025
Each stripe is one year: deviation from the 1961-1990 average. Colder years in blue, warmer years in amber.
Since pre-industrial times
How much has it warmed?
- What it is
- How much the average temperature has risen since pre-industrial times, when coal, oil and gas were still barely used.
- Why it matters
- It is the effect we feel: extreme heat, drought, retreating glaciers and heavy rain all depend on it. It is also the number international agreements are built on, such as the Paris Agreement.
In Switzerland, temperatures have risen more than twice as much as the global average: far from the sea, the Alps are warming faster.
Every extra tenth of a degree means hotter, drier summers, retreating glaciers, heavier rain and ecosystems under pressure.
Almost all the extra heat ends up in the oceans: that’s why the effects will last a long time, even after we have cut emissions.
See the values year by year
| Year | °C |
|---|---|
| 1864 | −1.4 |
| 1865 | −0.2 |
| 1866 | 0.0 |
| 1867 | −0.5 |
| 1868 | +0.2 |
| 1869 | −0.5 |
| 1870 | −1.2 |
| 1871 | −1.5 |
| 1872 | +0.1 |
| 1873 | −0.2 |
| 1874 | −0.8 |
| 1875 | −0.7 |
| 1876 | −0.3 |
| 1877 | −0.5 |
| 1878 | −1.0 |
| 1879 | −1.7 |
| 1880 | −0.1 |
| 1881 | −0.6 |
| 1882 | −0.5 |
| 1883 | −1.1 |
| 1884 | −0.4 |
| 1885 | −0.5 |
| 1886 | −0.6 |
| 1887 | −1.6 |
| 1888 | −1.3 |
| 1889 | −1.6 |
| 1890 | −1.4 |
| 1891 | −1.3 |
| 1892 | −0.6 |
| 1893 | −0.3 |
| 1894 | −0.6 |
| 1895 | −0.9 |
| 1896 | −1.3 |
| 1897 | −0.1 |
| 1898 | +0.2 |
| 1899 | 0.0 |
| 1900 | −0.1 |
| 1901 | −1.2 |
| 1902 | −0.7 |
| 1903 | −0.7 |
| 1904 | 0.0 |
| 1905 | −1.0 |
| 1906 | −0.7 |
| 1907 | −0.7 |
| 1908 | −0.8 |
| 1909 | −1.4 |
| 1910 | −0.9 |
| 1911 | +0.3 |
| 1912 | −0.8 |
| 1913 | −0.3 |
| 1914 | −0.6 |
| 1915 | −0.8 |
| 1916 | −0.4 |
| 1917 | −1.3 |
| 1918 | −0.2 |
| 1919 | −1.2 |
| 1920 | +0.5 |
| 1921 | +0.7 |
| 1922 | −0.9 |
| 1923 | −0.2 |
| 1924 | −0.5 |
| 1925 | −0.5 |
| 1926 | +0.2 |
| 1927 | −0.1 |
| 1928 | +0.3 |
| 1929 | −0.5 |
| 1930 | +0.3 |
| 1931 | −0.9 |
| 1932 | −0.3 |
| 1933 | −0.7 |
| 1934 | +0.6 |
| 1935 | −0.6 |
| 1936 | −0.2 |
| 1937 | 0.0 |
| 1938 | −0.2 |
| 1939 | −0.5 |
| 1940 | −1.1 |
| 1941 | −1.0 |
| 1942 | −0.3 |
| 1943 | +0.7 |
| 1944 | −0.6 |
| 1945 | +0.3 |
| 1946 | +0.2 |
| 1947 | +1.0 |
| 1948 | +0.7 |
| 1949 | +0.9 |
| 1950 | +0.5 |
| 1951 | +0.1 |
| 1952 | −0.2 |
| 1953 | +0.3 |
| 1954 | −0.5 |
| 1955 | −0.4 |
| 1956 | −1.5 |
| 1957 | +0.2 |
| 1958 | +0.1 |
| 1959 | +0.7 |
| 1960 | −0.2 |
| 1961 | +1.0 |
| 1962 | −0.9 |
| 1963 | −0.9 |
| 1964 | +0.4 |
| 1965 | −0.9 |
| 1966 | +0.1 |
| 1967 | +0.1 |
| 1968 | −0.2 |
| 1969 | −0.5 |
| 1970 | −0.5 |
| 1971 | 0.0 |
| 1972 | −0.3 |
| 1973 | −0.3 |
| 1974 | −0.1 |
| 1975 | +0.2 |
| 1976 | 0.0 |
| 1977 | +0.2 |
| 1978 | −0.4 |
| 1979 | −0.1 |
| 1980 | −0.7 |
| 1981 | −0.1 |
| 1982 | +0.6 |
| 1983 | +0.8 |
| 1984 | −0.5 |
| 1985 | −0.2 |
| 1986 | 0.0 |
| 1987 | +0.1 |
| 1988 | +0.8 |
| 1989 | +1.3 |
| 1990 | +1.1 |
| 1991 | +0.4 |
| 1992 | +1.2 |
| 1993 | +0.6 |
| 1994 | +1.8 |
| 1995 | +0.6 |
| 1996 | 0.0 |
| 1997 | +1.3 |
| 1998 | +0.9 |
| 1999 | +0.8 |
| 2000 | +1.4 |
| 2001 | +0.9 |
| 2002 | +1.5 |
| 2003 | +1.7 |
| 2004 | +0.8 |
| 2005 | +0.4 |
| 2006 | +1.4 |
| 2007 | +1.5 |
| 2008 | +1.0 |
| 2009 | +1.2 |
| 2010 | +0.1 |
| 2011 | +2.0 |
| 2012 | +1.2 |
| 2013 | +0.7 |
| 2014 | +1.9 |
| 2015 | +2.1 |
| 2016 | +1.5 |
| 2017 | +1.6 |
| 2018 | +2.3 |
| 2019 | +1.9 |
| 2020 | +2.3 |
| 2021 | +1.1 |
| 2022 | +2.8 |
| 2023 | +2.7 |
| 2024 | +2.6 |
| 2025 | +2.4 |
Parts per million
CO₂ in the atmosphere
- What it is
- How much carbon dioxide there is in the air, in parts per million (ppm): out of a million molecules of air, how many are CO₂.
- Why it matters
- It is the cause: CO₂ traps heat (the greenhouse effect). By burning coal, oil and gas we have pushed it to levels the ice cores do not show in the last 800,000 years.
Climate change worldwide
Many scientific indicators show clearly that our planet is going through profound changes: rising global average temperatures, rising sea levels, melting ice caps and glaciers, thawing permafrost, a disrupted water cycle and the collapse of entire ecosystems. On top of this comes the growing frequency of extreme weather events: heatwaves, extreme rainfall and long periods of drought. The scientific evidence shows that these changes are entirely due to greenhouse gas emissions from human activities (MeteoSwiss, n.d.).
To measure how much the planet has warmed, we compare the global average temperature of the pre-industrial period (1871-1900) with the temperatures that followed. The data show that, since industrialisation began, the Earth’s average temperature has risen by about +1.3 °C. In Switzerland the situation is even more critical: here the average rise is +2.8 °C, more than double the global average (FOEN, 2026). The increase has sped up since the 1960s, and the decade 2015-2024 is the warmest on record. In particular, 2024 set a record, with an anomaly of +1.5 °C compared with the pre-industrial average (MeteoSwiss, n.d.).
Global surface temperature over the last 2,000 years
- Reconstruction (with the uncertainty range)
- Observations
Hover over the chart to read the values.
Deviation in °C from the 1850-1900 average. Reconstruction from palaeoclimate archives (years 1-2000) and observations (1850-2020). Data: IPCC AR6, Figure SPM.1a, the same figure used by MeteoSwiss (n.d.).
Data files: IPCC AR6 WGI, Figure SPM.1a — SPM1_1-2000.csv ↗ · SPM1_1850-2020_obs.csv ↗ (CC BY 4.0)
See the values
| Year | Reconstruction (°C) | range (°C) | Observations (°C) |
|---|---|---|---|
| 10 | +0.10 | from −0.11 to +0.38 | |
| 20 | +0.10 | from −0.11 to +0.37 | |
| 30 | +0.16 | from −0.08 to +0.42 | |
| 40 | +0.20 | from −0.11 to +0.47 | |
| 50 | +0.11 | from −0.11 to +0.40 | |
| 60 | +0.16 | from −0.06 to +0.59 | |
| 70 | +0.21 | from −0.02 to +0.52 | |
| 80 | +0.19 | from 0.00 to +0.45 | |
| 90 | +0.17 | from −0.02 to +0.43 | |
| 100 | +0.10 | from −0.13 to +0.41 | |
| 110 | +0.14 | from −0.08 to +0.45 | |
| 120 | +0.15 | from −0.06 to +0.44 | |
| 130 | +0.12 | from −0.09 to +0.43 | |
| 140 | +0.18 | from −0.05 to +0.48 | |
| 150 | +0.18 | from −0.05 to +0.50 | |
| 160 | +0.20 | from −0.01 to +0.53 | |
| 170 | +0.11 | from −0.09 to +0.40 | |
| 180 | +0.05 | from −0.15 to +0.34 | |
| 190 | +0.13 | from −0.07 to +0.37 | |
| 200 | +0.14 | from −0.04 to +0.38 | |
| 210 | +0.18 | from −0.02 to +0.44 | |
| 220 | +0.14 | from −0.06 to +0.43 | |
| 230 | +0.16 | from −0.05 to +0.43 | |
| 240 | +0.27 | from +0.07 to +0.50 | |
| 250 | +0.27 | from +0.06 to +0.50 | |
| 260 | +0.14 | from −0.08 to +0.37 | |
| 270 | +0.13 | from −0.13 to +0.39 | |
| 280 | +0.22 | from −0.05 to +0.39 | |
| 290 | +0.18 | from −0.05 to +0.39 | |
| 300 | +0.25 | from 0.00 to +0.45 | |
| 310 | +0.26 | from +0.03 to +0.47 | |
| 320 | +0.18 | from −0.04 to +0.40 | |
| 330 | +0.13 | from −0.08 to +0.37 | |
| 340 | +0.15 | from −0.12 to +0.34 | |
| 350 | +0.16 | from −0.12 to +0.36 | |
| 360 | +0.13 | from −0.11 to +0.38 | |
| 370 | +0.11 | from −0.16 to +0.38 | |
| 380 | +0.16 | from −0.09 to +0.43 | |
| 390 | +0.09 | from −0.12 to +0.35 | |
| 400 | +0.18 | from −0.06 to +0.40 | |
| 410 | +0.24 | from +0.03 to +0.48 | |
| 420 | +0.18 | from −0.01 to +0.44 | |
| 430 | +0.21 | from +0.01 to +0.45 | |
| 440 | +0.24 | from +0.02 to +0.47 | |
| 450 | +0.20 | from 0.00 to +0.46 | |
| 460 | +0.18 | from −0.05 to +0.44 | |
| 470 | +0.10 | from −0.12 to +0.35 | |
| 480 | +0.18 | from −0.03 to +0.47 | |
| 490 | +0.24 | from −0.03 to +0.47 | |
| 500 | +0.23 | from −0.04 to +0.42 | |
| 510 | +0.16 | from −0.08 to +0.34 | |
| 520 | +0.21 | from −0.04 to +0.43 | |
| 530 | +0.18 | from −0.09 to +0.36 | |
| 540 | +0.03 | from −0.26 to +0.27 | |
| 550 | +0.03 | from −0.25 to +0.30 | |
| 560 | +0.15 | from −0.07 to +0.35 | |
| 570 | +0.19 | from −0.04 to +0.41 | |
| 580 | +0.14 | from −0.07 to +0.37 | |
| 590 | +0.24 | from +0.07 to +0.46 | |
| 600 | +0.22 | from +0.03 to +0.51 | |
| 610 | +0.17 | from −0.08 to +0.46 | |
| 620 | +0.19 | from −0.04 to +0.40 | |
| 630 | +0.14 | from −0.07 to +0.34 | |
| 640 | +0.10 | from −0.08 to +0.32 | |
| 650 | +0.12 | from −0.11 to +0.33 | |
| 660 | +0.16 | from −0.06 to +0.39 | |
| 670 | +0.23 | from +0.02 to +0.55 | |
| 680 | +0.22 | from −0.08 to +0.43 | |
| 690 | −0.01 | from −0.25 to +0.27 | |
| 700 | +0.13 | from −0.12 to +0.32 | |
| 710 | +0.20 | from 0.00 to +0.40 | |
| 720 | +0.17 | from −0.05 to +0.39 | |
| 730 | +0.20 | from −0.01 to +0.39 | |
| 740 | +0.16 | from −0.05 to +0.36 | |
| 750 | +0.20 | from +0.01 to +0.45 | |
| 760 | +0.28 | from +0.07 to +0.43 | |
| 770 | +0.25 | from +0.03 to +0.43 | |
| 780 | +0.16 | from −0.04 to +0.36 | |
| 790 | +0.15 | from −0.08 to +0.34 | |
| 800 | +0.13 | from −0.09 to +0.34 | |
| 810 | +0.14 | from −0.07 to +0.38 | |
| 820 | +0.16 | from −0.05 to +0.37 | |
| 830 | +0.15 | from −0.03 to +0.39 | |
| 840 | +0.18 | from 0.00 to +0.39 | |
| 850 | +0.12 | from −0.09 to +0.36 | |
| 860 | +0.05 | from −0.16 to +0.29 | |
| 870 | +0.15 | from −0.08 to +0.33 | |
| 880 | +0.27 | from +0.05 to +0.46 | |
| 890 | +0.21 | from +0.04 to +0.44 | |
| 900 | +0.11 | from −0.08 to +0.30 | |
| 910 | +0.15 | from −0.06 to +0.35 | |
| 920 | +0.15 | from −0.02 to +0.40 | |
| 930 | +0.24 | from +0.05 to +0.49 | |
| 940 | +0.19 | from −0.02 to +0.43 | |
| 950 | +0.17 | from −0.03 to +0.36 | |
| 960 | +0.17 | from −0.04 to +0.34 | |
| 970 | +0.20 | from −0.01 to +0.38 | |
| 980 | +0.16 | from −0.02 to +0.34 | |
| 990 | +0.15 | from −0.02 to +0.37 | |
| 1000 | +0.14 | from −0.05 to +0.34 | |
| 1010 | +0.13 | from −0.08 to +0.33 | |
| 1020 | +0.15 | from −0.03 to +0.33 | |
| 1030 | +0.16 | from −0.04 to +0.35 | |
| 1040 | +0.16 | from −0.07 to +0.34 | |
| 1050 | +0.15 | from −0.06 to +0.32 | |
| 1060 | +0.13 | from −0.06 to +0.33 | |
| 1070 | +0.10 | from −0.06 to +0.31 | |
| 1080 | +0.20 | from +0.02 to +0.40 | |
| 1090 | +0.13 | from −0.03 to +0.32 | |
| 1100 | +0.07 | from −0.09 to +0.31 | |
| 1110 | −0.02 | from −0.19 to +0.22 | |
| 1120 | −0.01 | from −0.18 to +0.23 | |
| 1130 | −0.01 | from −0.17 to +0.24 | |
| 1140 | +0.05 | from −0.12 to +0.29 | |
| 1150 | +0.09 | from −0.08 to +0.32 | |
| 1160 | +0.17 | from +0.01 to +0.39 | |
| 1170 | +0.12 | from −0.04 to +0.33 | |
| 1180 | +0.09 | from −0.08 to +0.35 | |
| 1190 | +0.03 | from −0.12 to +0.27 | |
| 1200 | +0.03 | from −0.12 to +0.27 | |
| 1210 | +0.05 | from −0.10 to +0.27 | |
| 1220 | +0.07 | from −0.07 to +0.28 | |
| 1230 | +0.03 | from −0.12 to +0.27 | |
| 1240 | +0.10 | from −0.07 to +0.33 | |
| 1250 | +0.14 | from −0.09 to +0.34 | |
| 1260 | +0.01 | from −0.14 to +0.24 | |
| 1270 | +0.02 | from −0.19 to +0.23 | |
| 1280 | +0.02 | from −0.20 to +0.24 | |
| 1290 | −0.04 | from −0.19 to +0.19 | |
| 1300 | −0.02 | from −0.16 to +0.19 | |
| 1310 | +0.07 | from −0.08 to +0.26 | |
| 1320 | +0.11 | from −0.05 to +0.27 | |
| 1330 | +0.08 | from −0.10 to +0.27 | |
| 1340 | −0.01 | from −0.19 to +0.20 | |
| 1350 | −0.07 | from −0.29 to +0.16 | |
| 1360 | −0.03 | from −0.23 to +0.18 | |
| 1370 | +0.05 | from −0.18 to +0.23 | |
| 1380 | +0.06 | from −0.22 to +0.23 | |
| 1390 | +0.05 | from −0.26 to +0.22 | |
| 1400 | +0.05 | from −0.19 to +0.23 | |
| 1410 | +0.08 | from −0.19 to +0.23 | |
| 1420 | +0.06 | from −0.19 to +0.22 | |
| 1430 | +0.10 | from −0.16 to +0.26 | |
| 1440 | +0.02 | from −0.24 to +0.20 | |
| 1450 | −0.10 | from −0.33 to +0.11 | |
| 1460 | −0.14 | from −0.38 to +0.08 | |
| 1470 | −0.14 | from −0.40 to +0.09 | |
| 1480 | −0.08 | from −0.34 to +0.13 | |
| 1490 | −0.01 | from −0.31 to +0.17 | |
| 1500 | −0.01 | from −0.33 to +0.16 | |
| 1510 | +0.02 | from −0.34 to +0.20 | |
| 1520 | −0.05 | from −0.41 to +0.14 | |
| 1530 | +0.02 | from −0.36 to +0.18 | |
| 1540 | −0.01 | from −0.33 to +0.15 | |
| 1550 | +0.02 | from −0.32 to +0.17 | |
| 1560 | +0.09 | from −0.26 to +0.21 | |
| 1570 | +0.04 | from −0.31 to +0.19 | |
| 1580 | −0.04 | from −0.34 to +0.12 | |
| 1590 | −0.06 | from −0.34 to +0.10 | |
| 1600 | −0.13 | from −0.45 to +0.05 | |
| 1610 | −0.07 | from −0.46 to +0.12 | |
| 1620 | −0.09 | from −0.40 to +0.10 | |
| 1630 | −0.05 | from −0.34 to +0.12 | |
| 1640 | −0.11 | from −0.40 to +0.08 | |
| 1650 | −0.06 | from −0.41 to +0.11 | |
| 1660 | 0.00 | from −0.33 to +0.15 | |
| 1670 | −0.12 | from −0.43 to +0.06 | |
| 1680 | −0.11 | from −0.40 to +0.10 | |
| 1690 | +0.01 | from −0.31 to +0.15 | |
| 1700 | −0.16 | from −0.40 to +0.01 | |
| 1710 | −0.09 | from −0.28 to +0.10 | |
| 1720 | −0.01 | from −0.21 to +0.17 | |
| 1730 | 0.00 | from −0.23 to +0.17 | |
| 1740 | −0.05 | from −0.24 to +0.12 | |
| 1750 | −0.04 | from −0.26 to +0.16 | |
| 1760 | +0.02 | from −0.16 to +0.19 | |
| 1770 | +0.03 | from −0.15 to +0.18 | |
| 1780 | −0.02 | from −0.18 to +0.14 | |
| 1790 | +0.01 | from −0.16 to +0.16 | |
| 1800 | +0.09 | from −0.09 to +0.20 | |
| 1810 | −0.09 | from −0.26 to +0.04 | |
| 1820 | −0.11 | from −0.27 to +0.03 | |
| 1830 | −0.05 | from −0.21 to +0.08 | |
| 1840 | −0.14 | from −0.31 to 0.00 | |
| 1850 | −0.04 | from −0.25 to +0.07 | |
| 1860 | −0.06 | from −0.23 to +0.06 | −0.05 |
| 1870 | 0.00 | from −0.16 to +0.12 | +0.03 |
| 1880 | +0.02 | from −0.16 to +0.12 | +0.07 |
| 1890 | +0.01 | from −0.14 to +0.12 | −0.08 |
| 1900 | +0.05 | from −0.15 to +0.15 | −0.03 |
| 1910 | −0.02 | from −0.17 to +0.09 | −0.11 |
| 1920 | +0.09 | from −0.04 to +0.21 | −0.01 |
| 1930 | +0.22 | from +0.07 to +0.34 | +0.10 |
| 1940 | +0.35 | from +0.17 to +0.45 | +0.29 |
| 1950 | +0.33 | from +0.19 to +0.44 | +0.24 |
| 1960 | +0.33 | from +0.20 to +0.45 | +0.22 |
| 1970 | +0.29 | from +0.18 to +0.43 | +0.24 |
| 1980 | +0.41 | from +0.29 to +0.53 | +0.41 |
| 1990 | +0.58 | from +0.43 to +0.70 | +0.55 |
| 2000 | +0.77 | ||
| 2010 | +0.92 |
The rise in temperature is not the same everywhere. Over land, warming is stronger (+1.6 °C) than over the oceans (+0.9 °C), which can store more heat. Latitude matters too: in the northern regions of the northern hemisphere the rise is even sharper (MeteoSwiss, n.d.).
How much it has warmed since pre-industrial times
Rise in average temperature compared with the pre-industrial period. Data: MeteoSwiss (n.d.) for land, oceans and the global average; FOEN (2026) for Switzerland.
Data files: UFAM, Clima: in breve ↗ · MeteoSvizzera, I cambiamenti climatici ↗
You sometimes hear that the climate has always changed. But it is essential to stress that “global temperature has never been this high in the last 2,000 years and, very probably, not even in the last 125,000 years” (MeteoSwiss, n.d.).
Climate change in Switzerland
In Switzerland the rise in temperature is even more striking than the global average. Since measurements began, temperatures have risen by +2.8 °C compared with the pre-industrial period (FOEN, 2026), more than double the global average. As MeteoSwiss (n.d.) points out, from the 1960s onwards “each decade has been warmer than the one before”.
This difference from the global average is mainly explained by two factors:
-
Warming over the oceans is lower than over land
The oceans can store heat in their deeper layers, something that does not happen on land. This means that the heat held by the oceans is spread out and absorbed more slowly, while over land it stays concentrated in the atmosphere, amplifying the rise in temperature.
-
Latitude
According to MeteoSwiss (n.d.), two things play a decisive role: the shrinking of snow- and ice-covered surfaces, which means more solar radiation is absorbed, and the stronger transport of heat energy from low latitudes towards the poles.
In short, the much sharper rise in temperature in Switzerland can be explained both by its geographical position in a continental area and by its location at mid-to-high latitudes.
Humans and climate change
To understand the link between human activities and climate change, it helps to explain one of the key processes: the greenhouse effect.
The natural greenhouse effect
The greenhouse effect is an entirely natural process that regulates the climate and temperatures on Earth. The solar radiation that reaches our planet is distributed like this (MeteoSwiss, n.d.):
- about 50% is absorbed by the Earth’s surface, warming it
- about 20% is absorbed by the atmosphere, warming it
- the remaining 30% is reflected back into space
The Earth’s surface, in turn, gives off energy as infrared radiation (heat). Greenhouse gases – such as water vapour, carbon dioxide (CO₂), methane (CH₄) and nitrous oxide (N₂O) – trap part of this energy and release it again as heat, warming the atmosphere. Thanks to this mechanism, the global average temperature is about +14 °C instead of –18 °C: without the natural greenhouse effect, the Earth would be a frozen planet, hostile to life as we know it (NASA, n.d.).
The human-caused greenhouse effect
Since industrialisation, humans have released ever larger amounts of greenhouse gases into the atmosphere.
Carbon dioxide in the atmosphere over the last 800,000 years
- Antarctic ice cores
- Direct measurements (Mauna Loa, since 1959)
Hover over the chart to read the values.
The last 10,000 years
CO₂ concentration in parts per million (ppm). Data: Bereiter et al. (2015), ice cores (NOAA); NOAA, Mauna Loa Observatory, annual averages 1959-2025.
Data files: NOAA NCEI, Bereiter et al. (2015) — antarctica2015co2composite.txt ↗ · NOAA GML — co2_annmean_mlo.txt ↗
See the values
| Year | ppm |
|---|---|
| 1959 | 316 |
| 1960 | 317 |
| 1961 | 318 |
| 1962 | 318 |
| 1963 | 319 |
| 1964 | 320 |
| 1965 | 320 |
| 1966 | 321 |
| 1967 | 322 |
| 1968 | 323 |
| 1969 | 325 |
| 1970 | 326 |
| 1971 | 326 |
| 1972 | 327 |
| 1973 | 330 |
| 1974 | 330 |
| 1975 | 331 |
| 1976 | 332 |
| 1977 | 334 |
| 1978 | 335 |
| 1979 | 337 |
| 1980 | 339 |
| 1981 | 340 |
| 1982 | 341 |
| 1983 | 343 |
| 1984 | 345 |
| 1985 | 346 |
| 1986 | 348 |
| 1987 | 349 |
| 1988 | 352 |
| 1989 | 353 |
| 1990 | 354 |
| 1991 | 356 |
| 1992 | 357 |
| 1993 | 357 |
| 1994 | 359 |
| 1995 | 361 |
| 1996 | 363 |
| 1997 | 364 |
| 1998 | 367 |
| 1999 | 369 |
| 2000 | 370 |
| 2001 | 371 |
| 2002 | 373 |
| 2003 | 376 |
| 2004 | 378 |
| 2005 | 380 |
| 2006 | 382 |
| 2007 | 384 |
| 2008 | 386 |
| 2009 | 388 |
| 2010 | 390 |
| 2011 | 392 |
| 2012 | 394 |
| 2013 | 397 |
| 2014 | 399 |
| 2015 | 401 |
| 2016 | 404 |
| 2017 | 407 |
| 2018 | 409 |
| 2019 | 412 |
| 2020 | 414 |
| 2021 | 416 |
| 2022 | 419 |
| 2023 | 421 |
| 2024 | 425 |
| 2025 | 427 |
| When | ppm |
|---|---|
| about 801,000 years ago | 199 |
| about 790,000 years ago | 235 |
| about 780,000 years ago | 254 |
| about 770,000 years ago | 226 |
| about 760,000 years ago | 225 |
| about 750,000 years ago | 190 |
| about 740,000 years ago | 185 |
| about 730,000 years ago | 210 |
| about 720,000 years ago | 212 |
| about 710,000 years ago | 231 |
| about 700,000 years ago | 237 |
| about 690,000 years ago | 232 |
| about 680,000 years ago | 233 |
| about 670,000 years ago | 188 |
| about 661,000 years ago | 188 |
| about 650,000 years ago | 189 |
| about 640,000 years ago | 190 |
| about 630,000 years ago | 201 |
| about 620,000 years ago | 246 |
| about 611,000 years ago | 258 |
| about 600,000 years ago | 229 |
| about 590,000 years ago | 248 |
| about 580,000 years ago | 251 |
| about 570,000 years ago | 250 |
| about 560,000 years ago | 230 |
| about 550,000 years ago | 209 |
| about 540,000 years ago | 206 |
| about 530,000 years ago | 221 |
| about 520,000 years ago | 248 |
| about 510,000 years ago | 240 |
| about 500,000 years ago | 231 |
| about 490,000 years ago | 253 |
| about 480,000 years ago | 231 |
| about 470,000 years ago | 206 |
| about 460,000 years ago | 202 |
| about 450,000 years ago | 208 |
| about 441,000 years ago | 202 |
| about 429,000 years ago | 243 |
| about 420,000 years ago | 271 |
| about 410,000 years ago | 275 |
| about 400,000 years ago | 277 |
| about 389,000 years ago | 246 |
| about 379,000 years ago | 230 |
| about 371,000 years ago | 202 |
| about 361,000 years ago | 186 |
| about 349,000 years ago | 220 |
| about 340,000 years ago | 240 |
| about 330,000 years ago | 275 |
| about 320,000 years ago | 233 |
| about 310,000 years ago | 226 |
| about 300,000 years ago | 231 |
| about 290,000 years ago | 235 |
| about 280,000 years ago | 205 |
| about 270,000 years ago | 194 |
| about 259,000 years ago | 204 |
| about 249,000 years ago | 215 |
| about 240,000 years ago | 253 |
| about 230,000 years ago | 225 |
| about 219,000 years ago | 241 |
| about 210,000 years ago | 245 |
| about 199,000 years ago | 243 |
| about 190,000 years ago | 231 |
| about 180,000 years ago | 208 |
| about 170,000 years ago | 197 |
| about 160,000 years ago | 188 |
| about 150,000 years ago | 202 |
| about 140,000 years ago | 193 |
| about 130,000 years ago | 261 |
| about 120,000 years ago | 269 |
| about 110,000 years ago | 244 |
| about 100,000 years ago | 246 |
| about 90,000 years ago | 229 |
| about 80,000 years ago | 235 |
| about 70,000 years ago | 216 |
| about 60,000 years ago | 217 |
| about 50,000 years ago | 204 |
| about 40,000 years ago | 193 |
| about 30,000 years ago | 192 |
| about 20,000 years ago | 194 |
| about 10,000 years ago | 264 |
| 1950 | 312 |
The main causes are:
- Burning fossil fuels (coal, oil and natural gas) and fires, which release huge amounts of CO₂ (MeteoSwiss, n.d.; NASA, n.d.; United Nations, n.d.).
- Intensive farming and gas and oil extraction (United Nations, n.d.), which produce high emissions of methane (CH₄) (United Nations, n.d.), a greenhouse gas with an effect on the climate 80 times greater than CO₂.
- Deforestation and land-use change.
Over the last 150 years the concentration of carbon dioxide has risen by more than 50%, from 280 ppm (parts per million) to 427 ppm (2025 annual average) (NOAA, n.d.): a level not seen for more than two million years. Today’s figure is about 150% of 1750 levels.
Carbon dioxide measured at Mauna Loa (Hawaii), since 1958
- Monthly average
- Trend without the seasonal swings
Hover over the chart to read the values.
Concentration of carbon dioxide (in parts per million) in the atmosphere; measurements taken at the Mauna Loa Observatory (Hawaii) from March 1958 to September 2026. Data: NOAA (n.d.).
Data files: NOAA GML — co2_mm_mlo.txt ↗
See the values
The months that NOAA marks as interpolated (December 1975 and April 1984) are left out.
| Year | Jan | Feb | Mar | Apr | May | Jun | Jul | Aug | Sept | Oct | Nov | Dec |
|---|---|---|---|---|---|---|---|---|---|---|---|---|
| 1958 | 315.71 | 317.45 | 317.51 | 317.27 | 315.87 | 314.93 | 313.21 | 312.42 | 313.33 | 314.67 | ||
| 1959 | 315.58 | 316.49 | 316.65 | 317.72 | 318.29 | 318.15 | 316.54 | 314.80 | 313.84 | 313.33 | 314.81 | 315.58 |
| 1960 | 316.43 | 316.98 | 317.58 | 319.03 | 320.03 | 319.58 | 318.18 | 315.90 | 314.17 | 313.83 | 315.00 | 316.19 |
| 1961 | 316.89 | 317.70 | 318.54 | 319.48 | 320.58 | 319.77 | 318.56 | 316.79 | 314.99 | 315.31 | 316.10 | 317.01 |
| 1962 | 317.94 | 318.55 | 319.68 | 320.57 | 321.02 | 320.62 | 319.61 | 317.40 | 316.24 | 315.42 | 316.69 | 317.70 |
| 1963 | 318.74 | 319.07 | 319.86 | 321.38 | 322.24 | 321.49 | 319.74 | 317.77 | 316.21 | 315.99 | 317.07 | 318.35 |
| 1964 | 319.57 | 320.04 | 320.75 | 321.84 | 322.25 | 321.89 | 320.44 | 318.69 | 316.71 | 316.87 | 317.68 | 318.71 |
| 1965 | 319.44 | 320.44 | 320.89 | 322.14 | 322.17 | 321.87 | 321.21 | 318.87 | 317.82 | 317.30 | 318.87 | 319.42 |
| 1966 | 320.62 | 321.60 | 322.39 | 323.70 | 324.08 | 323.75 | 322.37 | 320.36 | 318.64 | 318.10 | 319.78 | 321.02 |
| 1967 | 322.33 | 322.50 | 323.03 | 324.41 | 325.00 | 324.09 | 322.54 | 320.92 | 319.25 | 319.39 | 320.73 | 321.96 |
| 1968 | 322.57 | 323.15 | 323.89 | 325.02 | 325.57 | 325.36 | 324.14 | 322.11 | 320.33 | 320.25 | 321.32 | 322.89 |
| 1969 | 324.00 | 324.41 | 325.63 | 326.66 | 327.38 | 326.71 | 325.88 | 323.66 | 322.38 | 321.78 | 322.85 | 324.11 |
| 1970 | 325.06 | 325.99 | 326.93 | 328.13 | 328.08 | 327.67 | 326.34 | 324.68 | 323.10 | 323.06 | 324.01 | 325.13 |
| 1971 | 326.17 | 326.69 | 327.18 | 327.78 | 328.93 | 328.57 | 327.36 | 325.43 | 323.36 | 323.56 | 324.80 | 326.01 |
| 1972 | 326.77 | 327.63 | 327.75 | 329.72 | 330.07 | 329.09 | 328.04 | 326.32 | 324.84 | 325.20 | 326.50 | 327.55 |
| 1973 | 328.55 | 329.57 | 330.30 | 331.50 | 332.48 | 332.07 | 330.87 | 329.31 | 327.52 | 327.19 | 328.17 | 328.65 |
| 1974 | 329.36 | 330.71 | 331.49 | 332.65 | 333.19 | 332.20 | 331.07 | 329.15 | 327.33 | 327.28 | 328.31 | 329.58 |
| 1975 | 330.73 | 331.46 | 331.94 | 333.11 | 333.95 | 333.42 | 331.97 | 329.95 | 328.49 | 328.36 | 329.38 | |
| 1976 | 331.56 | 332.74 | 333.36 | 334.74 | 334.72 | 333.97 | 333.08 | 330.68 | 328.96 | 328.72 | 330.16 | 331.62 |
| 1977 | 332.68 | 333.17 | 334.96 | 336.14 | 336.93 | 336.17 | 334.89 | 332.56 | 331.29 | 331.28 | 332.46 | 333.60 |
| 1978 | 334.94 | 335.26 | 336.66 | 337.69 | 338.02 | 338.01 | 336.50 | 334.42 | 332.36 | 332.45 | 333.76 | 334.91 |
| 1979 | 336.14 | 336.69 | 338.27 | 338.82 | 339.24 | 339.26 | 337.54 | 335.72 | 333.97 | 334.24 | 335.32 | 336.81 |
| 1980 | 337.90 | 338.34 | 340.07 | 340.93 | 341.45 | 341.36 | 339.45 | 337.67 | 336.25 | 336.14 | 337.30 | 338.29 |
| 1981 | 339.29 | 340.55 | 341.63 | 342.60 | 343.04 | 342.54 | 340.82 | 338.48 | 336.95 | 337.05 | 338.58 | 339.91 |
| 1982 | 340.93 | 341.76 | 342.78 | 343.96 | 344.77 | 343.88 | 342.42 | 340.24 | 338.37 | 338.41 | 339.44 | 340.78 |
| 1983 | 341.57 | 342.78 | 343.37 | 345.40 | 346.14 | 345.76 | 344.32 | 342.51 | 340.46 | 340.53 | 341.79 | 343.20 |
| 1984 | 344.21 | 344.92 | 345.68 | 347.77 | 347.16 | 345.79 | 343.74 | 341.59 | 341.86 | 343.31 | 345.00 | |
| 1985 | 345.48 | 346.41 | 347.91 | 348.66 | 349.28 | 348.65 | 346.90 | 345.26 | 343.47 | 343.35 | 344.73 | 346.12 |
| 1986 | 346.78 | 347.48 | 348.25 | 349.86 | 350.52 | 349.98 | 348.25 | 346.17 | 345.48 | 344.82 | 346.22 | 347.48 |
| 1987 | 348.73 | 348.92 | 349.81 | 351.40 | 352.15 | 351.58 | 350.21 | 348.20 | 346.66 | 346.72 | 348.08 | 349.28 |
| 1988 | 350.51 | 351.70 | 352.50 | 353.67 | 354.35 | 353.88 | 352.80 | 350.49 | 348.97 | 349.37 | 350.42 | 351.62 |
| 1989 | 353.07 | 353.43 | 354.08 | 355.72 | 355.95 | 355.44 | 354.05 | 351.84 | 350.09 | 350.33 | 351.55 | 352.91 |
| 1990 | 353.86 | 355.10 | 355.75 | 356.38 | 357.38 | 356.39 | 354.89 | 353.06 | 351.38 | 351.69 | 353.14 | 354.41 |
| 1991 | 354.93 | 355.82 | 357.33 | 358.77 | 359.23 | 358.23 | 356.30 | 353.97 | 352.34 | 352.43 | 353.89 | 355.21 |
| 1992 | 356.34 | 357.21 | 357.97 | 359.22 | 359.71 | 359.44 | 357.15 | 354.99 | 353.01 | 353.40 | 354.42 | 355.68 |
| 1993 | 357.10 | 357.42 | 358.59 | 359.39 | 360.30 | 359.64 | 357.45 | 355.76 | 354.14 | 354.23 | 355.53 | 357.03 |
| 1994 | 358.36 | 359.04 | 360.11 | 361.36 | 361.78 | 360.94 | 359.51 | 357.59 | 355.86 | 356.21 | 357.65 | 359.10 |
| 1995 | 360.04 | 361.00 | 361.98 | 363.44 | 363.83 | 363.33 | 361.78 | 359.33 | 358.32 | 358.14 | 359.61 | 360.82 |
| 1996 | 362.20 | 363.36 | 364.28 | 364.69 | 365.25 | 365.06 | 363.69 | 361.55 | 359.69 | 359.72 | 361.04 | 362.39 |
| 1997 | 363.24 | 364.21 | 364.65 | 366.49 | 366.77 | 365.73 | 364.46 | 362.40 | 360.44 | 360.97 | 362.65 | 364.51 |
| 1998 | 365.39 | 366.10 | 367.36 | 368.79 | 369.56 | 369.13 | 367.98 | 366.10 | 364.16 | 364.54 | 365.67 | 367.30 |
| 1999 | 368.35 | 369.28 | 369.84 | 371.15 | 371.12 | 370.46 | 369.61 | 367.06 | 364.95 | 365.52 | 366.88 | 368.26 |
| 2000 | 369.45 | 369.71 | 370.75 | 371.98 | 371.75 | 371.87 | 370.02 | 368.27 | 367.15 | 367.18 | 368.53 | 369.83 |
| 2001 | 370.76 | 371.69 | 372.63 | 373.55 | 374.03 | 373.40 | 371.68 | 369.78 | 368.34 | 368.61 | 369.94 | 371.42 |
| 2002 | 372.70 | 373.37 | 374.30 | 375.19 | 375.93 | 375.69 | 374.16 | 372.03 | 370.92 | 370.73 | 372.43 | 373.98 |
| 2003 | 375.07 | 375.82 | 376.64 | 377.92 | 378.78 | 378.46 | 376.88 | 374.57 | 373.34 | 373.31 | 374.84 | 376.17 |
| 2004 | 377.17 | 378.05 | 379.06 | 380.54 | 380.80 | 379.87 | 377.65 | 376.17 | 374.43 | 374.63 | 376.33 | 377.68 |
| 2005 | 378.63 | 379.91 | 380.95 | 382.48 | 382.64 | 382.40 | 380.93 | 378.93 | 376.89 | 377.19 | 378.54 | 380.31 |
| 2006 | 381.58 | 382.40 | 382.86 | 384.80 | 385.22 | 384.24 | 382.65 | 380.60 | 379.04 | 379.33 | 380.35 | 382.02 |
| 2007 | 383.10 | 384.12 | 384.81 | 386.73 | 386.78 | 386.33 | 384.73 | 382.24 | 381.20 | 381.37 | 382.70 | 384.19 |
| 2008 | 385.78 | 386.06 | 386.28 | 387.33 | 388.78 | 387.99 | 386.62 | 384.32 | 383.41 | 383.22 | 384.41 | 385.79 |
| 2009 | 387.17 | 387.70 | 389.04 | 389.76 | 390.36 | 389.70 | 388.24 | 386.29 | 384.95 | 384.64 | 386.23 | 387.63 |
| 2010 | 388.91 | 390.41 | 391.37 | 392.67 | 393.21 | 392.38 | 390.41 | 388.54 | 387.03 | 387.43 | 388.87 | 389.99 |
| 2011 | 391.50 | 392.05 | 392.80 | 393.44 | 394.41 | 393.95 | 392.72 | 390.33 | 389.28 | 389.19 | 390.48 | 392.06 |
| 2012 | 393.31 | 394.04 | 394.59 | 396.38 | 396.93 | 395.91 | 394.56 | 392.59 | 391.32 | 391.27 | 393.20 | 394.57 |
| 2013 | 395.78 | 397.03 | 397.66 | 398.64 | 400.02 | 398.81 | 397.51 | 395.39 | 393.72 | 393.90 | 395.36 | 397.03 |
| 2014 | 398.04 | 398.27 | 399.91 | 401.51 | 401.96 | 401.43 | 399.27 | 397.18 | 395.54 | 396.16 | 397.40 | 399.08 |
| 2015 | 400.18 | 400.55 | 401.74 | 403.35 | 404.15 | 402.97 | 401.46 | 399.11 | 397.82 | 398.49 | 400.27 | 402.06 |
| 2016 | 402.73 | 404.25 | 405.06 | 407.60 | 407.90 | 406.99 | 404.59 | 402.45 | 401.23 | 401.79 | 403.72 | 404.64 |
| 2017 | 406.36 | 406.66 | 407.54 | 409.22 | 409.89 | 409.08 | 407.33 | 405.32 | 403.57 | 403.82 | 405.31 | 407.00 |
| 2018 | 408.15 | 408.52 | 409.59 | 410.45 | 411.44 | 410.99 | 408.90 | 407.16 | 405.71 | 406.19 | 408.21 | 409.27 |
| 2019 | 411.03 | 411.96 | 412.18 | 413.54 | 414.86 | 414.15 | 411.96 | 410.17 | 408.76 | 408.74 | 410.47 | 411.97 |
| 2020 | 413.59 | 414.32 | 414.72 | 416.42 | 417.28 | 416.58 | 414.58 | 412.75 | 411.50 | 411.49 | 413.10 | 414.23 |
| 2021 | 415.49 | 416.72 | 417.61 | 419.01 | 419.09 | 418.93 | 416.90 | 414.42 | 413.26 | 413.90 | 414.97 | 416.67 |
| 2022 | 418.13 | 419.24 | 418.76 | 420.19 | 420.97 | 420.94 | 418.85 | 417.15 | 415.91 | 415.74 | 417.47 | 418.99 |
| 2023 | 419.48 | 420.31 | 420.99 | 423.35 | 424.00 | 423.68 | 421.83 | 419.68 | 418.50 | 418.82 | 420.46 | 421.86 |
| 2024 | 422.80 | 424.55 | 425.38 | 426.51 | 426.90 | 426.91 | 425.55 | 422.99 | 422.03 | 422.38 | 423.85 | 425.40 |
| 2025 | 426.65 | 427.09 | 428.15 | 429.64 | 430.51 | 429.61 | 427.87 | 425.48 | 424.37 | 424.87 | 426.46 | 427.49 |
| 2026 | 428.62 | 429.35 | 430.15 | 431.12 | 432.34 | 431.43 | 429.13 | 427.55 | 426.07 |
| Year | Jan | Feb | Mar | Apr | May | Jun | Jul | Aug | Sept | Oct | Nov | Dec |
|---|---|---|---|---|---|---|---|---|---|---|---|---|
| 1958 | 314.44 | 315.16 | 314.69 | 315.15 | 315.20 | 316.21 | 316.11 | 315.41 | 315.21 | 315.43 | ||
| 1959 | 315.52 | 315.84 | 315.37 | 315.42 | 315.46 | 316.00 | 315.87 | 316.09 | 316.75 | 316.34 | 316.69 | 316.35 |
| 1960 | 316.38 | 316.33 | 316.27 | 316.70 | 317.19 | 317.45 | 317.54 | 317.22 | 317.10 | 316.85 | 316.89 | 316.96 |
| 1961 | 316.84 | 317.05 | 317.25 | 317.16 | 317.73 | 317.61 | 317.89 | 318.09 | 317.92 | 318.34 | 318.00 | 317.78 |
| 1962 | 317.89 | 317.89 | 318.39 | 318.24 | 318.16 | 318.45 | 318.94 | 318.71 | 319.18 | 318.46 | 318.59 | 318.47 |
| 1963 | 318.69 | 318.41 | 318.57 | 319.05 | 319.38 | 319.31 | 319.07 | 319.07 | 319.16 | 319.03 | 318.98 | 319.13 |
| 1964 | 319.52 | 319.37 | 319.41 | 319.46 | 319.37 | 319.73 | 319.79 | 320.03 | 319.67 | 319.93 | 319.59 | 319.49 |
| 1965 | 319.38 | 319.79 | 319.59 | 319.79 | 319.28 | 319.68 | 320.53 | 320.18 | 320.78 | 320.37 | 320.79 | 320.20 |
| 1966 | 320.57 | 320.94 | 321.08 | 321.34 | 321.18 | 321.55 | 321.69 | 321.68 | 321.61 | 321.18 | 321.71 | 321.81 |
| 1967 | 322.28 | 321.83 | 321.72 | 322.05 | 322.09 | 321.89 | 321.86 | 322.24 | 322.24 | 322.48 | 322.66 | 322.74 |
| 1968 | 322.51 | 322.48 | 322.55 | 322.63 | 322.66 | 323.17 | 323.48 | 323.46 | 323.33 | 323.34 | 323.26 | 323.68 |
| 1969 | 323.95 | 323.75 | 324.31 | 324.28 | 324.46 | 324.49 | 325.19 | 324.99 | 325.38 | 324.89 | 324.80 | 324.91 |
| 1970 | 325.01 | 325.31 | 325.61 | 325.75 | 325.15 | 325.44 | 325.65 | 326.02 | 326.11 | 326.18 | 325.96 | 325.93 |
| 1971 | 326.12 | 326.01 | 325.85 | 325.39 | 325.99 | 326.34 | 326.67 | 326.77 | 326.38 | 326.69 | 326.75 | 326.81 |
| 1972 | 326.71 | 326.96 | 326.39 | 327.30 | 327.12 | 326.87 | 327.38 | 327.69 | 327.88 | 328.33 | 328.46 | 328.35 |
| 1973 | 328.49 | 328.89 | 328.97 | 329.10 | 329.52 | 329.83 | 330.18 | 330.66 | 330.56 | 330.33 | 330.13 | 329.45 |
| 1974 | 329.30 | 330.03 | 330.15 | 330.24 | 330.22 | 329.79 | 330.21 | 330.54 | 330.44 | 330.53 | 330.50 | 330.55 |
| 1975 | 330.84 | 330.85 | 330.37 | 330.53 | 330.98 | 331.01 | 331.12 | 331.33 | 331.60 | 331.61 | 331.57 | |
| 1976 | 331.67 | 332.14 | 331.79 | 332.16 | 331.75 | 331.56 | 332.23 | 332.07 | 332.07 | 331.98 | 332.35 | 332.59 |
| 1977 | 332.77 | 332.58 | 333.40 | 333.54 | 334.00 | 333.79 | 334.01 | 333.91 | 334.36 | 334.51 | 334.68 | 334.58 |
| 1978 | 335.01 | 334.60 | 335.00 | 335.07 | 335.08 | 335.60 | 335.65 | 335.87 | 335.51 | 335.72 | 335.99 | 335.87 |
| 1979 | 336.22 | 336.00 | 336.56 | 336.11 | 336.24 | 336.83 | 336.69 | 337.20 | 337.19 | 337.57 | 337.59 | 337.83 |
| 1980 | 338.13 | 337.85 | 338.51 | 338.31 | 338.40 | 338.85 | 338.56 | 339.07 | 339.38 | 339.40 | 339.46 | 339.26 |
| 1981 | 339.42 | 339.98 | 340.08 | 339.98 | 339.97 | 340.06 | 339.92 | 339.87 | 340.17 | 340.39 | 340.75 | 340.85 |
| 1982 | 341.09 | 341.16 | 341.18 | 341.32 | 341.67 | 341.43 | 341.61 | 341.64 | 341.56 | 341.77 | 341.59 | 341.71 |
| 1983 | 341.75 | 342.25 | 341.85 | 342.76 | 342.97 | 343.30 | 343.56 | 343.89 | 343.59 | 343.86 | 343.92 | 344.12 |
| 1984 | 344.32 | 344.39 | 344.26 | 344.59 | 344.73 | 345.02 | 345.12 | 344.76 | 345.19 | 345.41 | 345.88 | |
| 1985 | 345.59 | 345.92 | 346.56 | 346.08 | 346.12 | 346.23 | 346.08 | 346.57 | 346.59 | 346.60 | 346.82 | 347.04 |
| 1986 | 346.82 | 346.98 | 346.93 | 347.29 | 347.42 | 347.61 | 347.43 | 347.51 | 348.61 | 348.04 | 348.28 | 348.36 |
| 1987 | 348.66 | 348.24 | 348.39 | 348.84 | 349.09 | 349.29 | 349.51 | 349.65 | 349.85 | 349.96 | 350.15 | 350.14 |
| 1988 | 350.49 | 350.99 | 350.99 | 351.03 | 351.22 | 351.55 | 352.16 | 352.01 | 352.18 | 352.62 | 352.53 | 352.52 |
| 1989 | 352.99 | 352.69 | 352.60 | 353.07 | 352.78 | 353.06 | 353.38 | 353.43 | 353.37 | 353.57 | 353.68 | 353.84 |
| 1990 | 353.78 | 354.37 | 354.27 | 353.76 | 354.23 | 354.02 | 354.24 | 354.68 | 354.69 | 354.94 | 355.18 | 355.26 |
| 1991 | 354.91 | 355.11 | 355.79 | 356.13 | 356.10 | 355.88 | 355.69 | 355.59 | 355.66 | 355.69 | 355.87 | 356.02 |
| 1992 | 356.29 | 356.47 | 356.38 | 356.51 | 356.52 | 357.07 | 356.58 | 356.67 | 356.36 | 356.72 | 356.48 | 356.50 |
| 1993 | 357.06 | 356.54 | 356.88 | 356.71 | 357.14 | 357.24 | 356.87 | 357.44 | 357.51 | 357.60 | 357.65 | 357.92 |
| 1994 | 358.25 | 358.21 | 358.41 | 358.59 | 358.59 | 358.57 | 358.91 | 359.29 | 359.31 | 359.63 | 359.80 | 359.96 |
| 1995 | 359.91 | 360.18 | 360.37 | 360.76 | 360.73 | 360.98 | 361.11 | 360.93 | 361.70 | 361.52 | 361.75 | 361.67 |
| 1996 | 361.98 | 362.47 | 362.64 | 361.99 | 362.23 | 362.82 | 362.98 | 363.13 | 363.14 | 363.12 | 363.18 | 363.23 |
| 1997 | 363.03 | 363.40 | 363.02 | 363.82 | 363.87 | 363.56 | 363.74 | 363.98 | 363.83 | 364.28 | 364.71 | 365.28 |
| 1998 | 365.19 | 365.29 | 365.73 | 366.17 | 366.68 | 366.95 | 367.29 | 367.69 | 367.51 | 367.82 | 367.70 | 368.05 |
| 1999 | 368.13 | 368.46 | 368.24 | 368.62 | 368.31 | 368.29 | 368.93 | 368.63 | 368.28 | 368.80 | 368.86 | 368.93 |
| 2000 | 369.24 | 368.99 | 369.24 | 369.44 | 368.87 | 369.66 | 369.36 | 369.87 | 370.46 | 370.42 | 370.48 | 370.46 |
| 2001 | 370.60 | 370.95 | 371.06 | 370.99 | 371.11 | 371.18 | 371.08 | 371.39 | 371.61 | 371.85 | 371.92 | 372.09 |
| 2002 | 372.48 | 372.49 | 372.61 | 372.54 | 372.98 | 373.46 | 373.58 | 373.70 | 374.28 | 374.06 | 374.52 | 374.72 |
| 2003 | 374.82 | 374.95 | 374.99 | 375.24 | 375.73 | 376.22 | 376.37 | 376.27 | 376.65 | 376.65 | 376.99 | 376.93 |
| 2004 | 376.96 | 377.19 | 377.40 | 377.80 | 377.66 | 377.57 | 377.12 | 377.90 | 377.80 | 377.99 | 378.49 | 378.48 |
| 2005 | 378.37 | 379.10 | 379.45 | 379.84 | 379.49 | 380.07 | 380.38 | 380.61 | 380.20 | 380.50 | 380.69 | 381.09 |
| 2006 | 381.33 | 381.58 | 381.32 | 382.11 | 382.06 | 381.93 | 382.10 | 382.27 | 382.35 | 382.66 | 382.52 | 382.84 |
| 2007 | 382.88 | 383.22 | 383.17 | 383.95 | 383.56 | 384.06 | 384.25 | 383.95 | 384.56 | 384.72 | 384.90 | 385.07 |
| 2008 | 385.54 | 385.20 | 384.72 | 384.71 | 385.69 | 385.68 | 386.05 | 385.98 | 386.69 | 386.50 | 386.58 | 386.64 |
| 2009 | 386.86 | 386.81 | 387.54 | 387.15 | 387.24 | 387.46 | 387.77 | 387.99 | 388.22 | 387.88 | 388.36 | 388.43 |
| 2010 | 388.62 | 389.47 | 389.85 | 390.12 | 390.09 | 390.10 | 389.93 | 390.21 | 390.32 | 390.72 | 390.99 | 390.80 |
| 2011 | 391.19 | 391.12 | 391.27 | 390.83 | 391.24 | 391.64 | 392.24 | 392.04 | 392.60 | 392.53 | 392.64 | 392.86 |
| 2012 | 393.07 | 393.20 | 392.99 | 393.65 | 393.73 | 393.63 | 394.12 | 394.37 | 394.75 | 394.64 | 395.25 | 395.27 |
| 2013 | 395.62 | 396.23 | 396.07 | 395.79 | 396.64 | 396.48 | 397.13 | 397.27 | 397.24 | 397.25 | 397.35 | 397.78 |
| 2014 | 397.74 | 397.45 | 398.37 | 398.63 | 398.56 | 399.10 | 398.85 | 399.07 | 399.11 | 399.58 | 399.49 | 399.81 |
| 2015 | 399.92 | 399.77 | 400.22 | 400.46 | 400.70 | 400.65 | 401.11 | 401.04 | 401.43 | 401.89 | 402.24 | 402.72 |
| 2016 | 402.45 | 403.40 | 403.54 | 404.77 | 404.41 | 404.59 | 404.24 | 404.41 | 404.85 | 405.23 | 405.74 | 405.33 |
| 2017 | 406.04 | 405.80 | 406.05 | 406.37 | 406.37 | 406.68 | 407.01 | 407.31 | 407.17 | 407.23 | 407.36 | 407.71 |
| 2018 | 407.83 | 407.61 | 408.06 | 407.65 | 407.98 | 408.60 | 408.60 | 409.17 | 409.30 | 409.56 | 410.24 | 409.99 |
| 2019 | 410.69 | 410.97 | 410.71 | 410.92 | 411.47 | 411.74 | 411.64 | 412.10 | 412.26 | 412.09 | 412.50 | 412.71 |
| 2020 | 413.22 | 413.41 | 413.35 | 413.92 | 413.98 | 414.16 | 414.19 | 414.60 | 414.91 | 414.79 | 415.12 | 414.91 |
| 2021 | 415.23 | 415.80 | 416.17 | 416.58 | 415.88 | 416.48 | 416.48 | 416.27 | 416.63 | 417.14 | 416.93 | 417.37 |
| 2022 | 417.86 | 418.32 | 417.31 | 417.67 | 417.70 | 418.47 | 418.41 | 419.03 | 419.30 | 418.97 | 419.51 | 419.79 |
| 2023 | 419.19 | 419.34 | 419.54 | 420.83 | 420.71 | 421.25 | 421.45 | 421.61 | 421.98 | 422.07 | 422.41 | 422.59 |
| 2024 | 422.51 | 423.59 | 423.93 | 423.99 | 423.61 | 424.48 | 425.17 | 424.92 | 425.51 | 425.63 | 425.80 | 426.14 |
| 2025 | 426.36 | 426.12 | 426.69 | 427.12 | 427.22 | 427.18 | 427.49 | 427.41 | 427.85 | 428.12 | 428.40 | 428.22 |
| 2026 | 428.32 | 428.39 | 428.69 | 428.60 | 429.05 | 429.00 | 428.74 | 429.48 | 429.55 |
As you can see, although CO₂ levels are rising steadily, the curve also follows a regular cycle, going up and down over the course of the year. These seasonal swings are caused by the global cycles of photosynthesis. In the northern hemisphere, in spring, plants sprout and absorb CO₂ to grow: this lowers the level of CO₂ in the atmosphere.
In autumn, when growth slows down or plants decompose, CO₂ is released back into the atmosphere and the curve rises again. The same process happens in the southern hemisphere, but with the seasons reversed. However, because the northern hemisphere has much larger land areas and much more vegetation, the global seasonal cycle mainly follows the northern hemisphere’s.
This increase has strengthened the natural greenhouse effect, so that more heat energy stays trapped in the climate system. Almost all of this heat ends up in the oceans: from 1971 to 2018, 91% of the extra heat was absorbed by the oceans, 5% by the land, 3% melted ice and only 1% stayed in the atmosphere (IPCC, 2021). The oceans warm slowly and hold heat for a long time: this is why warming will continue even after we cut emissions.
The trapped heat, 1971–2018
It is important to stress that, as scientific research confirms, “all the warming observed since the start of industrialisation can be traced back to human activities. Solar activity, volcanism and internal variations in the climate system have played a negligible role” (MeteoSwiss, n.d.).
Sources
- IPCC (2021)
Sixth Assessment Report, Working Group I, FAQ 7.1: What is the Earth’s energy budget?
Accessed: 19 November 2026.
ipcc.ch ↗ - MeteoSwiss (n.d.)
I cambiamenti climatici [Climate change]
Accessed: 1 October 2025.
meteosvizzera.admin.ch ↗ - NASA (n.d.)
Carbon Dioxide – Earth Indicator
Accessed: 1 October 2025.
science.nasa.gov ↗ - NOAA Global Monitoring Laboratory (n.d.)
Trends in Atmospheric Carbon Dioxide, Mauna Loa
Accessed: 12 November 2026.
gml.noaa.gov ↗ - FOEN, Federal Office for the Environment (2026)
Clima: in breve [Climate: in brief]
Published 13 April 2026. Accessed: 12 November 2026.
bafu.admin.ch ↗ - United Nations (n.d.)
What Is Climate Change?
Accessed: 1 October 2025.
un.org ↗